Wellbeing Program Dashboard
Employee activity, health, and wellbeing analytics using Streamlit
📌 Project Overview
Employee Wellbeing Analytics Dashboard using Python & Streamlit to analyze activity, health indicators, and medical check-up data into actionable insights.
🎯 Objective
- Analyze employee activity patterns
- Understand relationship between activity and health
- Identify active vs inactive employees
- Support HR wellness decision-making
🔄 Data Flow
1. Data Sources
Data berasal dari 3 sumber utama yang saling melengkapi:
- Users → employee profile (employee id, employee name, department, age, gender)
- Activity Logs → sports activity data by strava (activity type, duration, heart rate, etc)
- MCU Records → medical check-up results
2. Data Integration
Semua dataset digabung menggunakan user_id sebagai primary key untuk membentuk satu unified dataset.
                df = activity.merge(users, on="user_id") df = df.merge(mcu,
                on="user_id")
3. Data Transformation
- Convert timestamp → datetime format
- Normalize duration → minutes
- Standardize activity types
- Handle missing values
4. Feature Engineering
- Total distance per employee
- Average heart rate per activity
- Total moving time
- BMI classification
5. Output Layer
Data yang sudah diproses digunakan untuk membangun KPI dashboard dan insight analysis:
- Employee wellbeing KPIs
- Activity performance tracking
- Health risk identification
- Interactive dashboard visualization
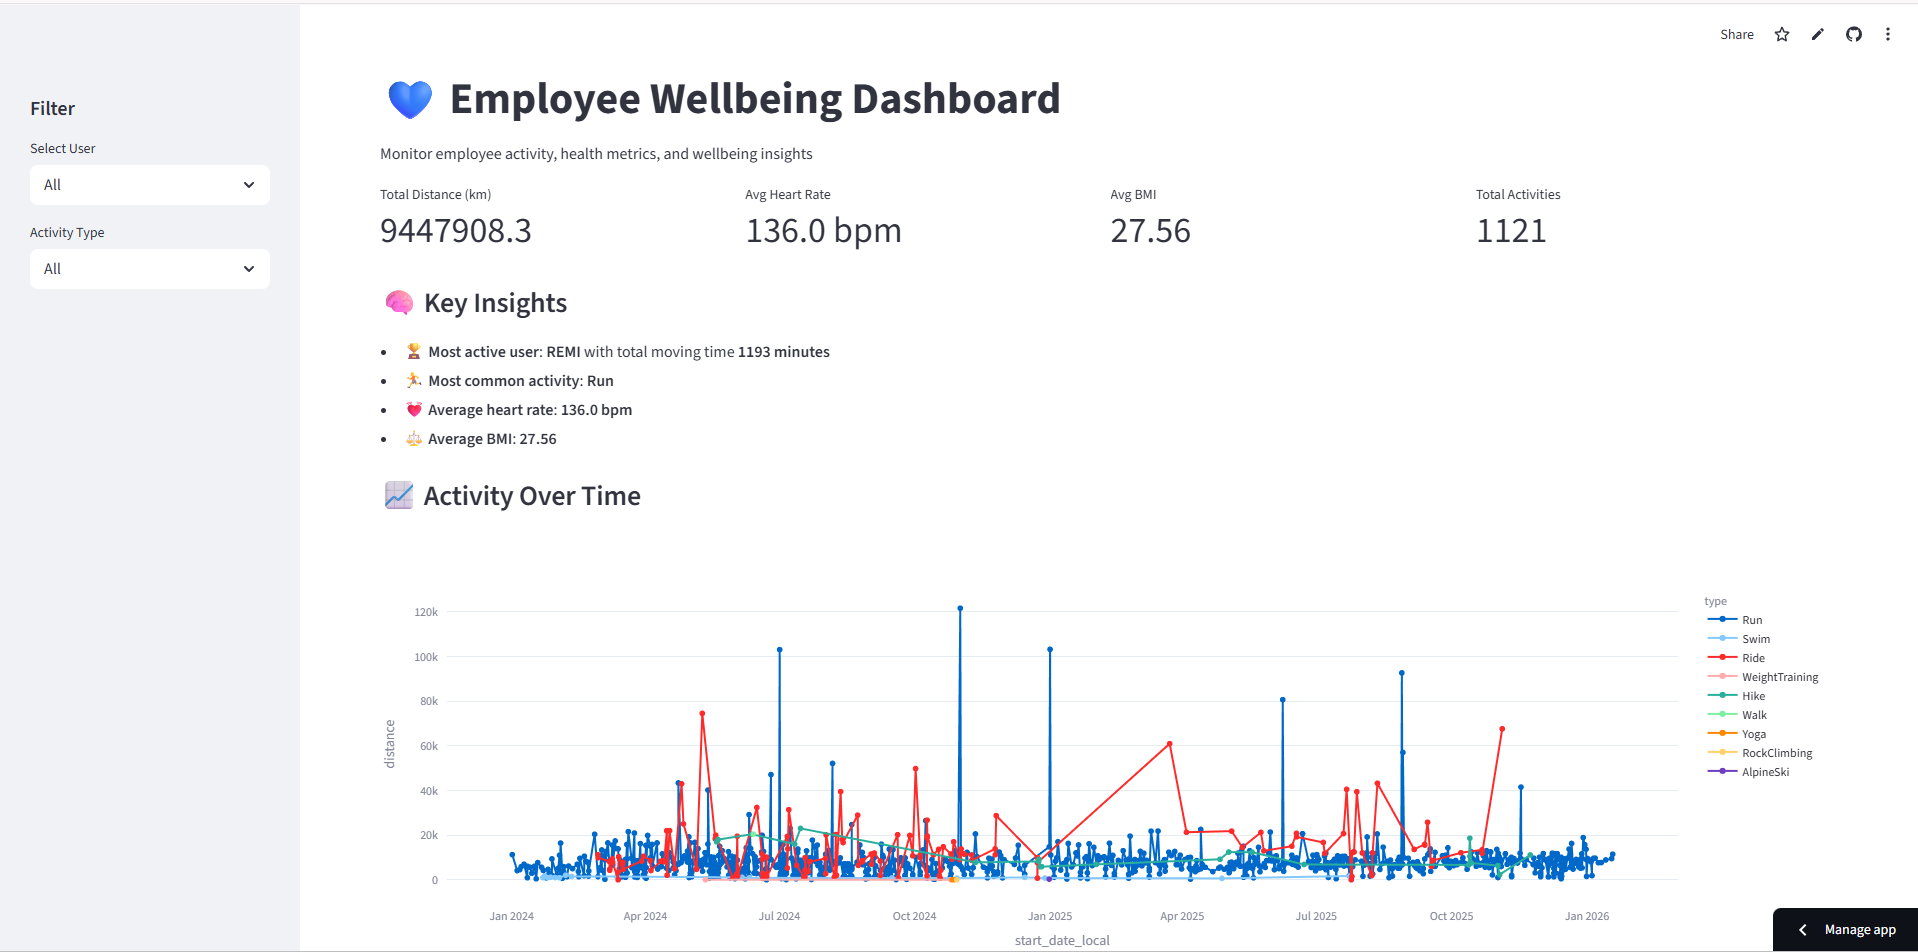
📊 KPI Summary
1. Total Distance
Streamlit Formula
k1.metric("Distance", f"{filtered_df['distance'].sum():.2f}
              km")
2. Average Heart Rate
AVERAGE(average_heartrate)
3. Active Employees
COUNT(DISTINCT user_id)
4. Total Activities
COUNT(activity_id)
5. Activity Types
DISTINCT(type)
6. BMI Category
              Underweight < 18.5 Normal 18.5 - 24.9 Overweight 25 - 29.9 Obese ≥
              30
7. Top Employee
SUM(moving_time) GROUP BY fullname
📈 Key Insights
- Activity level varies significantly across employees
- Walking & running dominate activities
- Higher activity correlates with better health
💡 Recommendation
- Encourage regular physical activity
- Monitor inactive employees
- Improve wellness initiatives
🚀 Business Impact
- Better employee health awareness
- Data-driven HR decisions
- Reduced burnout risk